Sankey Diagram
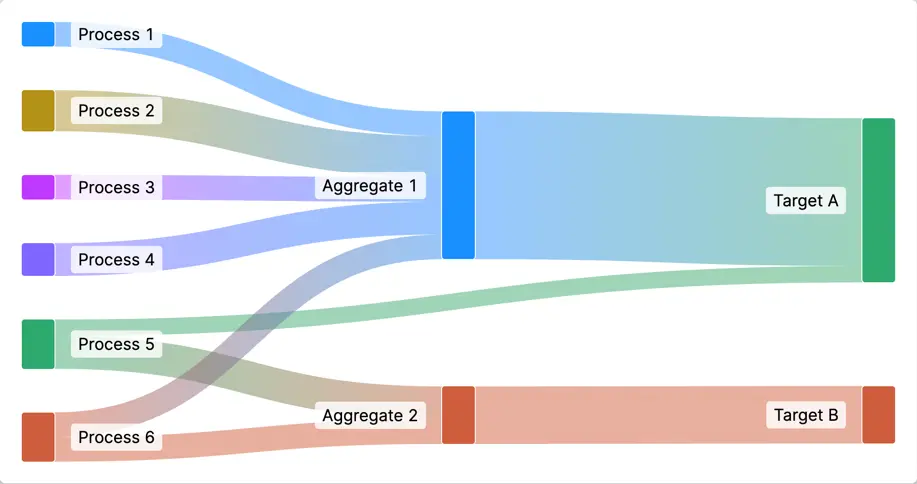
A Sankey Diagram displays flows between multiple nodes where link
width indicates the quantity or magnitude of the flow. The diagram
automatically scales link widths proportionally, ensuring that flow
relationships are accurately represented and easy to compare at a glance.
Adding & Linking Nodes
Each Sankey Node represents a point in your flow diagram. To add a node:
- Select the
Sankey Diagramin the HMI Content Tree - Add a new
Sankey Nodeelement - Configure its properties in the properties panel
The Sankey Diagram automatically calculates proportions based on the values you define:
- Link widths are drawn proportionally to represent the relative quantity of each flow
- Multiple outgoing links from a single node will split the flow visually
- The sum of outgoing link values equals the total input to that node
Properties
Container
This icon will be displayed next to the element's label on pages that support it, like the Dashboard Page. An Element can make use of the icon to:
- Provide more context to add meaning
- Improve recognition and discoverability, especially on larger pages
Action
Button that will be displayed in the upper right corner of the element. By pressing it, users can execute an action.
Action that gets executed when clicking the button. Use it to:
- Open overlays that provide additional context or detailed controls for this element using the Open Page as Overlay Action.
- Navigate to other pages using the Navigate to Page Action.
- Execute logic on your PLC using the Write Data Variable Action or Call Data Method Action
Display Condition
true or false you're good to go.Display Labels
Condition
Specify whether the node labels should be visible. Hiding labels can be helpful on smaller devices.